
The Architect’s Dilemma: Snowflake vs ClickHouse – A Strategic Analysis
Choosing between Snowflake and ClickHouse is rarely about “which is better.” It is about which one fits your workload, your operating model, and your time-to-value constraints. Snowflake is commonly positioned as a managed cloud data platform for governed analytics across teams. ClickHouse is widely used as a high-performance OLAP database for fast analytical queries, often in near real-time and at high concurrency.
This guide is built for decision makers and implementers: CTOs, Heads of Data, Data Platform and SRE leaders, Analytics Engineering leads, and ITO buyers who need to ship a working platform, not just select a tool. You will get:
A 60-second choice guide across three real scenarios
A workload-first framework (how query and data patterns decide the winner)
Practical comparisons on performance, cost (TCO), operations, security, and integration effort
A decision scorecard you can reuse
An ITO delivery plan with roles, deliverables, and acceptance criteria
The goal is simple: choose the right platform with confidence and deliver with minimal execution risk, using a multi-dimensional Snowflake vs ClickHouse comparison—then validating the decision by flipping the lens from ClickHouse vs Snowflake.
The 60-second answer: which one to choose in 3 real scenarios
Scenario A: Enterprise BI and governance-first analytics
Pick Snowflake when your core requirement is governed analytics across multiple teams, many business users, and strong operational guardrails. Typical signals include:
-
You prioritize reliability, access control, auditability, and consistent data sharing
-
You run a large BI footprint, standardized reporting, and multiple data domains
-
You want predictable operations with fewer platform-level responsibilities on your team
Scenario B: Real-time product analytics or observability with high concurrency
Pick ClickHouse when your workload is event-heavy, latency-sensitive, and concurrency-heavy, and when your value depends on interactive analytics at scale. Typical signals include:
-
You rely on near real-time dashboards and exploratory queries over large event streams
-
You have high query-per-second patterns, many simultaneous users, and tight p95 latency targets
-
You benefit from performance tuning leverage in exchange for more operational ownership
Scenario C: Hybrid is the best answer (often)
If your organization has both enterprise BI and real-time serving needs, a hybrid pattern can be the most pragmatic:
-
Use Snowflake as the governed warehouse and multi-team analytics layer
-
Use ClickHouse as the serving layer for real-time, high-concurrency analytics workloads
-
Connect them with clear data contracts and avoid duplicated business logic
If you remember one thing: choose by workload and operating model, then validate with a minimal POC that measures latency, concurrency, freshness, and cost drivers under realistic conditions.
Snowflake and ClickHouse in plain terms (only what matters for the decision)
What Snowflake is (and isn’t)
Snowflake is typically used as a managed cloud data platform for analytics: you store data, transform it, and query it through a model built for governed access, cross-team usage, and operational simplicity. The key value for many teams is not raw speed in one query, but the combination of manageability, governance, and scalable analytics workflows.
Snowflake is not primarily positioned as a “real-time serving database” for high-QPS interactive workloads where you control every layer of performance tuning. It can support low-latency patterns in certain designs, but the decision should reflect the dominant workload and your acceptance criteria.
What ClickHouse is (and isn’t)
ClickHouse is a column-oriented OLAP database designed for fast analytical queries over large datasets, commonly event data. It is often used where high concurrency and low query latency matter, including product analytics and observability use cases.
ClickHouse is not a “managed enterprise warehouse experience” by default. Even when you use managed offerings, ClickHouse-style success still depends heavily on workload modeling, table design, partitioning strategy, and disciplined operational practices.
The key architectural difference
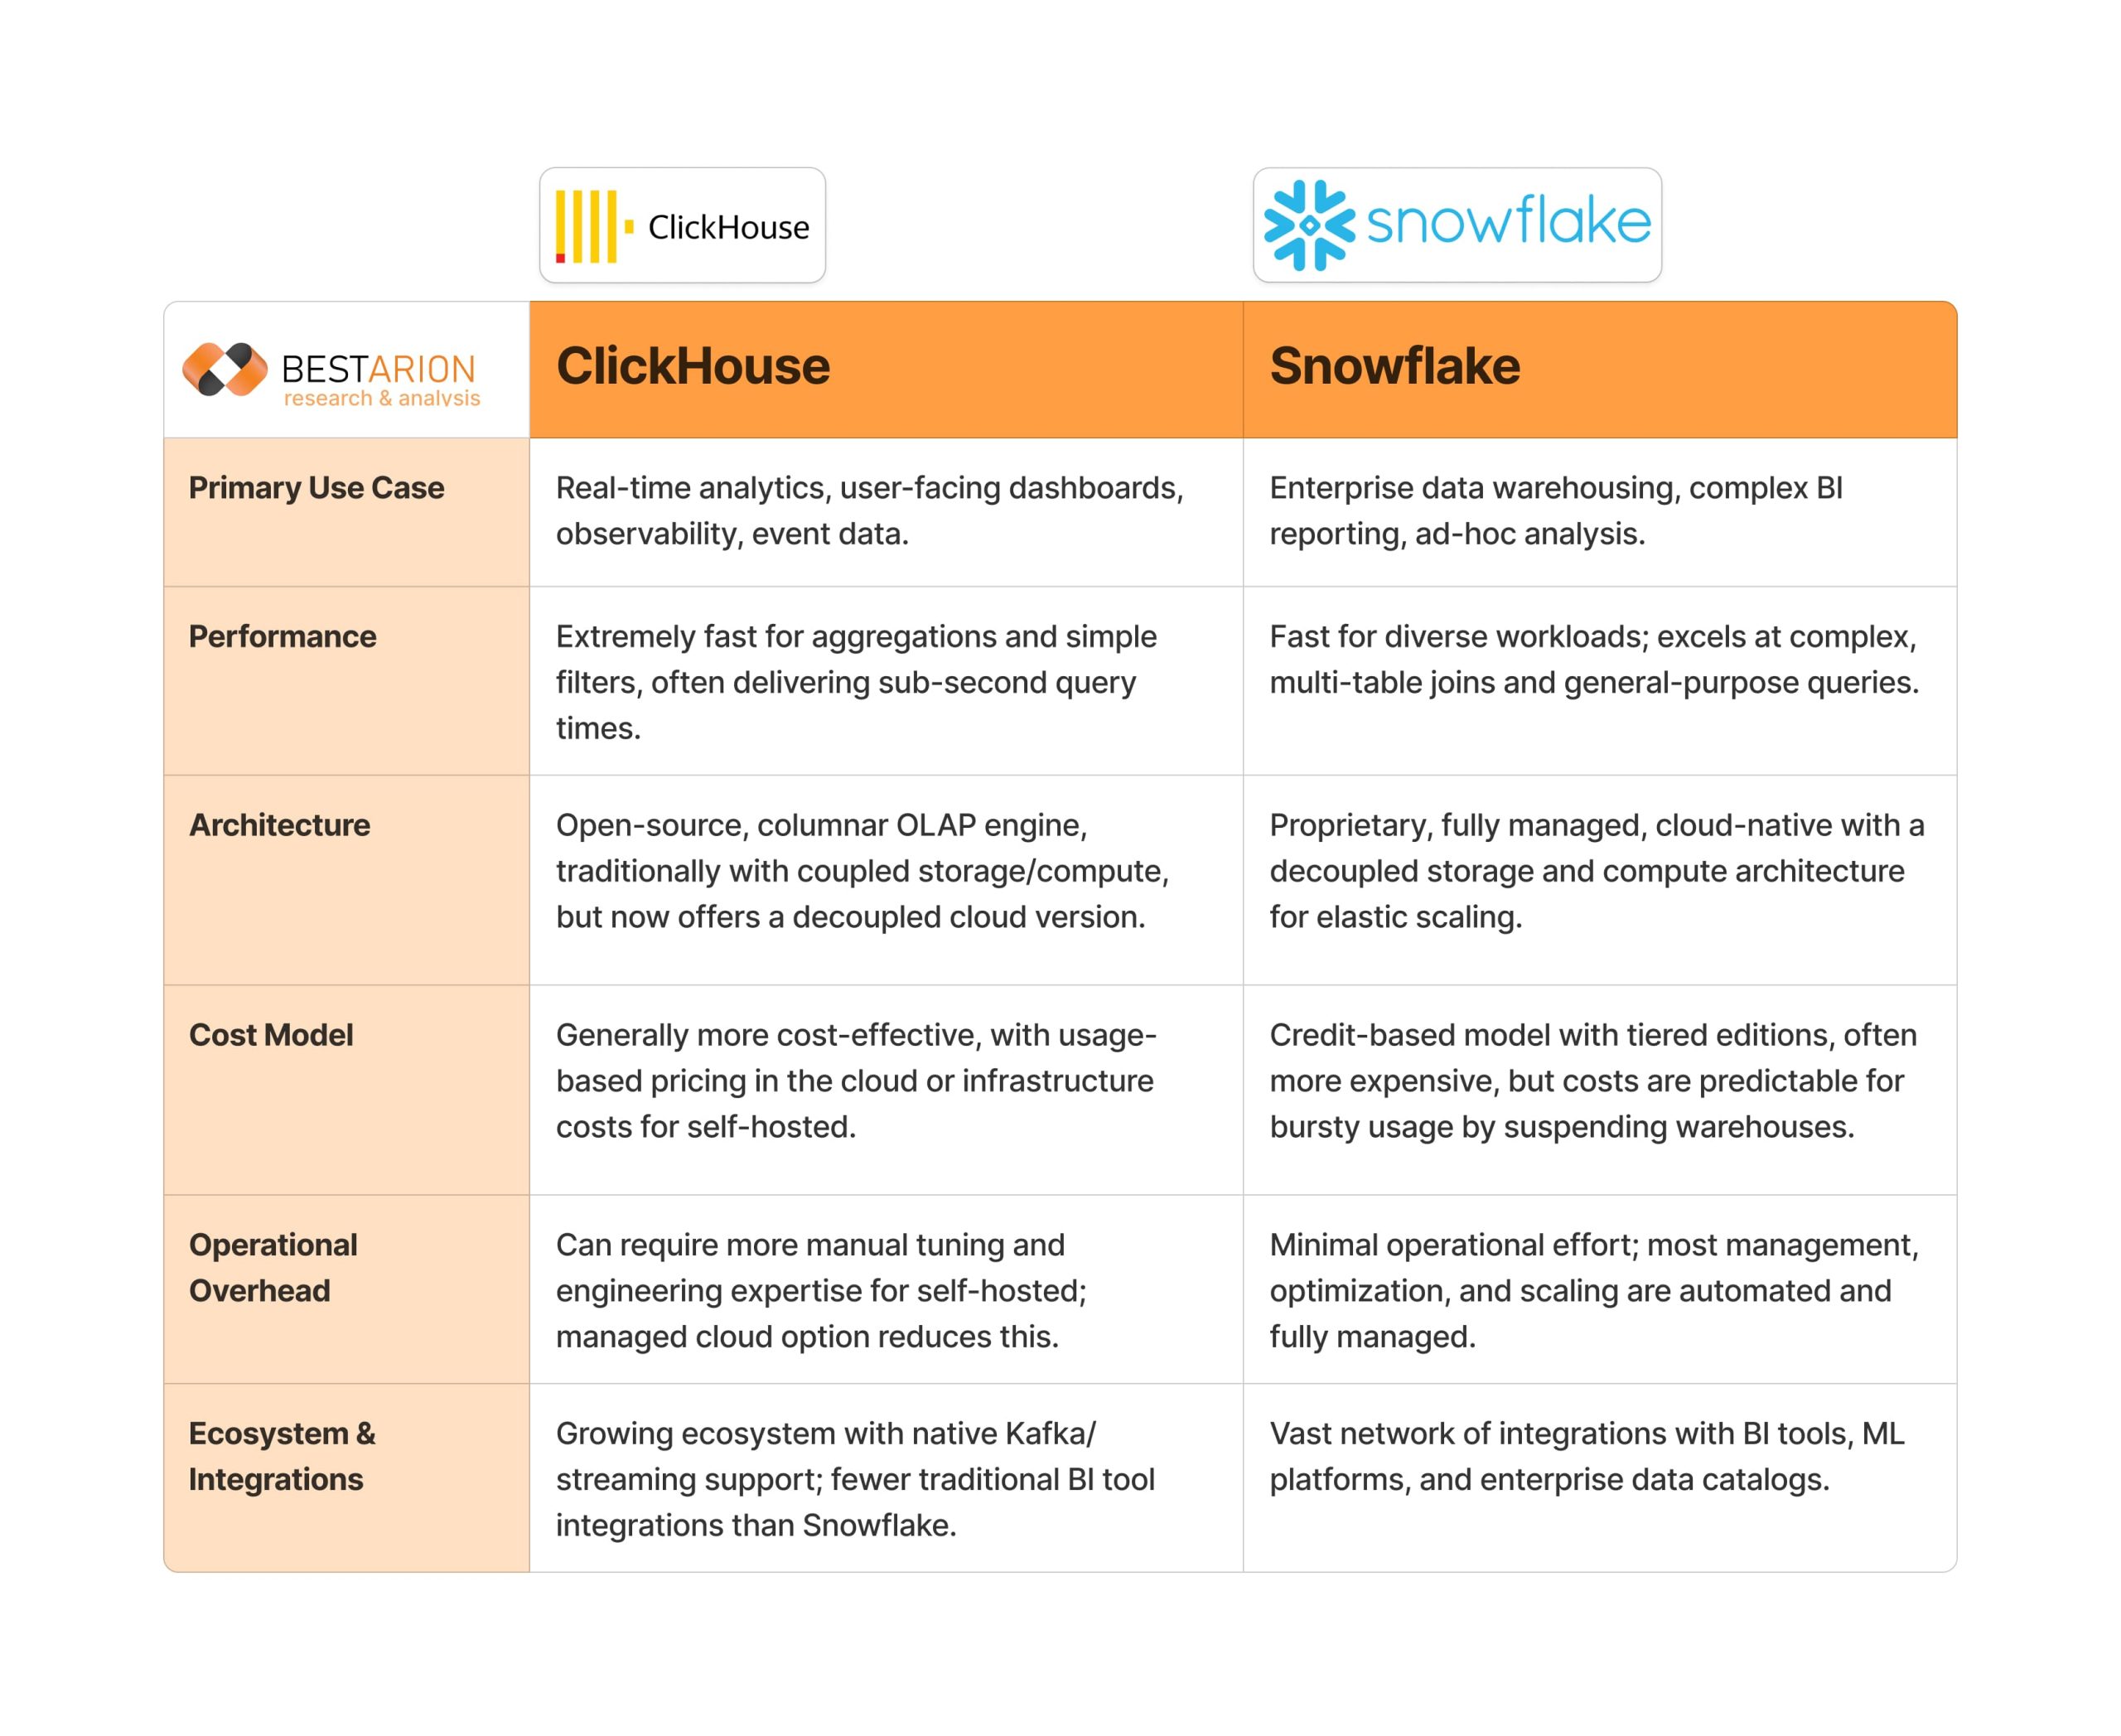
A useful mental model is this: Snowflake is optimized for governed analytics at scale with strong platform guardrails and reduced operational burden, while vs ClickHouse is optimized for analytical performance and concurrency where tuning and data layout choices can unlock significant gains. The trade-off is the balance between operational simplicity and performance control.
Quick glossary
-
Concurrency: many users or dashboards querying at the same time
-
Freshness: time from event to queryable data
-
p95 latency: user experience under load, not best-case speed
-
Data layout: partitioning, clustering, ordering, pre-aggregation patterns
Workload fit: how your query and data patterns decide the winner
Data shape: event streams vs curated models
ClickHouse often shines with wide, high-volume event data where queries scan and aggregate across time windows, dimensions, and attributes. Snowflake often fits well with curated models and multi-domain data where governance, transformations, and cross-team consumption are central.
Query shape: scans and aggregates vs transformation-heavy analytics
If your users run interactive aggregates, time-series slicing, and large scans across event tables, ClickHouse patterns can align well. If your analytics workflows are transformation-heavy, involve multiple teams, require standardized marts, and lean on governance controls, Snowflake patterns can align well.
Freshness and latency
If near real-time freshness is a hard requirement, you should explicitly define it as an SLA: not “real-time,” but measurable targets like “data is queryable within X minutes” and “p95 dashboard queries under Y seconds at peak concurrency.” The right platform is the one that meets your SLA with acceptable cost and operational risk.
Concurrency profile matters more than one query benchmark
Many decisions fail because teams evaluate a platform on a single fast query. In practice, concurrency and p95 under peak load define user experience. If your workload is “many users, many dashboards, many small queries,” you must test under load.
Red flags that signal mismatch
-
Choosing ClickHouse without a plan for operational ownership, observability, and on-call readiness
-
Choosing Snowflake when the core workload is high-QPS interactive analytics and tight p95 latency is a hard constraint
-
Ignoring data layout and modeling discipline in either platform
Performance: latency, concurrency, ingest, and what “fast” really means
Benchmark rules (to avoid misleading results)
Before comparing anything, lock the basics:
-
Dataset size and shape: including cardinality and skew
-
Query set: representative of your real dashboards and ad-hoc use
-
Warm vs cold runs: caching can change results dramatically
-
Concurrency window: measure under realistic parallel load
-
Success metrics: p50 and p95 latency, error rate, freshness, throughput
If you do not control these, your “performance comparison” will be noise.
Latency: what affects p50 vs p95
p50 tells you typical experience; p95 tells you peak pain. p95 is often driven by contention, hotspots, data layout inefficiencies, and resource scheduling.
Practical approach:
-
Identify the top queries by business value and volume
-
For each query, measure p50 and p95 under multiple concurrency levels
-
Track query plans and the impact of schema and layout changes
Concurrency: the real differentiator
Concurrency is where platform design choices and workload isolation strategies matter. You should ask:
-
Can you isolate workloads (BI jobs vs ad-hoc vs dashboards)?
-
What happens when several teams hit the system at the same time?
-
Does the system degrade gracefully or cliff?
A good test is to simulate:
-
A normal period (baseline concurrency)
-
A peak hour (expected concurrency)
-
A stress scenario (higher than expected)
Ingest and freshness: batch vs streaming trade-offs
Freshness is an end-to-end property: source capture, pipeline, transformations, load, and queryability. You should measure:
-
Time from event creation to query availability
-
Variance under load (not just best case)
If your workload depends on near real-time analytics, your architecture must treat freshness as an SLA, not a feature checkbox.
Query patterns that tend to favor Snowflake
Snowflake often fits well where the system must support:
-
Many teams consuming governed datasets
-
Standardized reporting and transformation workflows
-
Data sharing patterns across domains and stakeholders
-
Operational guardrails that reduce platform babysitting
Query patterns that tend to favor ClickHouse
ClickHouse often fits well where you need:
-
High concurrency over event data with fast aggregates
-
Interactive exploration and dashboard serving with tight latency targets
-
Performance leverage through data layout, ordering, and pre-aggregation strategies
A minimal POC test plan (what “good evidence” looks like)
Keep it lean:
-
Select 10 to 20 representative queries (dashboards plus ad-hoc)
-
Choose 2 to 3 dataset sizes (or one realistic size if time is limited)
-
Run at 3 concurrency levels (baseline, peak, stress)
-
Measure p50, p95, error rate, and freshness
-
Capture cost drivers and operational complexity notes
This produces decision-grade evidence without turning into a months-long project.
Cost (TCO): what actually drives spend in Snowflake vs ClickHouse
Cost model mental model
A helpful comparison is:
-
ClickHouse: cost is often driven by infrastructure sizing plus the operational effort to keep performance and reliability stable
In both cases, “cost” is not only a bill. It includes engineering time, incidents, and delivery drag.
- vs Snowflake: cost is often driven by consumption patterns and workload scheduling behavior
Snowflake cost drivers you must track
-
Workload shape and scheduling: spiky vs steady usage
-
Query patterns: inefficient scans and repeated transformations
-
Data retention and storage patterns
-
Data movement and duplication across environments
The main risk is “invisible consumption”: cost rises because workload discipline is not enforced.
ClickHouse cost drivers you must track
-
Infrastructure sizing: CPU, memory, storage, and replication choices
-
Data layout decisions that affect performance and resource use
-
Operational overhead: monitoring, tuning, incident response, upgrades
-
Engineering time spent on optimization and reliability hardening
The main risk is “hidden ops cost”: the system performs well, but the team pays for it in ongoing effort.
Hidden costs most teams miss
-
Data movement and egress between systems
-
Retries and pipeline instability that amplify compute
-
Over-provisioning to avoid latency issues
-
Incident overhead: on-call time, investigation, and fixes
Lightweight TCO worksheet (inputs you need)
You can estimate directionally without pricing tables by collecting:
-
Data volume today and projected growth
-
Query volume and peak concurrency windows
-
Freshness target and SLA requirements
-
Retention requirements and storage tiering approach
-
Team size and operational maturity (SRE readiness, runbook culture)
Practical cost optimization levers
-
For Snowflake-style patterns: enforce workload scheduling discipline, reduce redundant transformations, and standardize data products
-
For ClickHouse-style patterns: invest early in data layout, pre-aggregation strategy, and observability to reduce long-term tuning and incident cost
Operations and reliability: SRE burden, upgrades, observability, and runbooks
Ownership: what ops work exists and who does it
The key question is not “can it run,” but “who keeps it healthy.” Define ownership across:
-
Performance monitoring and tuning
-
Capacity planning and scaling
-
Incident response and postmortems
-
Upgrades and change management
-
Backup and recovery drills
For an ITO model, ambiguity here becomes delivery risk.
Scaling and capacity planning
You need a plan for:
-
Predictable BI workloads vs spiky dashboard traffic
-
Guardrails that prevent one team’s workload from hurting everyone else
-
“Peak day” behavior (product launches, reporting cycles)
Reliability: common failure modes and mitigation
Design for:
-
Degraded modes (partial service is better than total outage)
-
Rollback strategies for changes
-
Strong observability so you can find root causes quickly
Observability: minimum signals from day one
At minimum track:
-
Query latency distribution (p50, p95)
-
Concurrency and queue behavior
-
Resource saturation signals (CPU, memory, IO)
-
Error rates and retry patterns
-
Pipeline freshness metrics
Backup and DR readiness (RPO/RTO thinking)
Do not treat backup as “enabled.” Treat it as “tested.” Your readiness is determined by restore drills and clear RPO/RTO targets.
Minimum runbook checklist for ITO delivery
A usable runbook includes:
-
Alert definitions and thresholds
-
Triage steps and escalation paths
-
Known issues and quick mitigations
-
Performance regression playbook
-
Change management and rollback steps
-
Postmortem template and learning loop
Security and governance: access control, auditability, compliance readiness
RBAC and least-privilege patterns
Define roles based on responsibility, not org chart. Separate:
-
Platform admins
-
Data producers
-
Data consumers
-
Security reviewers and auditors
Audit trails and evidence collection
If you operate in regulated environments or enterprise governance contexts, define:
-
Access logging requirements
-
Data access review cadence
-
Evidence retention and reporting workflows
Encryption and key management considerations
Define minimum standards for:
-
Encryption in transit and at rest
-
Secrets handling and credential rotation
-
Key ownership and access boundaries
Data privacy controls
Establish:
-
Data classification and retention rules
-
Masking and restricted access patterns
-
Clear approval workflow for sensitive data access
A platform that cannot meet your governance requirements is not “fast,” it is risky.
Ecosystem and integration: ETL/ELT, streaming, BI tools, and workflow fit
Ingestion patterns: batch ELT vs streaming pipelines
Your integration complexity depends on whether you are:
-
Loading curated datasets on schedules
-
Ingesting continuous event streams with evolving schemas
BI and semantic layer considerations
What matters is user experience:
-
Dashboard responsiveness under peak usage
-
Caching behavior and consistency
-
Governance of metrics definitions (to avoid “metric drift”)
Orchestration, CI/CD, and IaC
A production-grade platform should support:
-
Multiple environments (dev, staging, prod)
-
Promotion workflows and testing
-
Reproducible infrastructure
Integration scoping checklist (ITO estimation inputs)
To scope accurately, collect:
-
Source systems list and data volumes
-
Freshness SLA and transformation complexity
-
BI tools and semantic layer approach
-
Security constraints and access model
Decision scorecard: 10 criteria to choose confidently (with scenario weights)
The 10 criteria (score 1 to 5)
Use this scorecard to make the decision explicit:
-
Workload fit (dominant query patterns)
-
Concurrency and p95 user experience
-
Freshness and ingestion requirements
-
Performance tuning leverage
-
Cost predictability (not just cost level)
-
Operational burden and team readiness
-
Reliability and recovery readiness
-
Security and governance fit
-
Ecosystem and integration effort
-
Time-to-value and delivery risk
Weighting suggestions for 3 scenarios
Use weights as guidance, not dogma:
-
Enterprise BI and governance-first: prioritize governance, integration, time-to-value, predictable operations
-
Real-time analytics and high concurrency: prioritize concurrency, p95 latency, freshness, tuning leverage
-
Hybrid platform: balance governance and real-time serving, emphasize integration design and data contracts
Must-haves vs nice-to-haves
Turn “opinions” into thresholds:
-
Must-have: freshness within SLA, p95 latency under target at peak concurrency, acceptable error rate
-
Nice-to-have: minor feature differences that do not affect SLA
What good evidence looks like
Decision-grade evidence comes from:
-
A minimal POC with documented queries and concurrency tests
-
Cost driver snapshots under realistic workloads
-
Operational readiness notes: what needs runbooks, alerts, and ownership
Migration: when it’s worth switching (and the risks to plan for)
Migration should be treated as a separate implementation program, not a minor section in a comparison post. Still, you should understand when it makes sense:
Common triggers
-
You cannot meet concurrency or p95 latency targets with your current platform approach
-
Your cost structure is misaligned with workload reality
-
Your real-time analytics requirement becomes a core product requirement
When migration is a bad idea
-
You have not stabilized your data model and metrics definitions
-
You cannot commit to operational ownership and observability practices
-
You cannot afford parallel runs and regression testing
Typical risks
-
SQL dialect and function differences
-
Data type and semantics mismatches
-
Performance regressions due to data layout choices
-
Operational surprises: on-call load, tuning effort, incident response readiness
Validation approach
Plan for:
-
Parallel run (old and new) for correctness and performance
-
Rollback strategy and cutover checkpoints
-
A clear definition of “done” tied to SLAs and user experience
Common pitfalls (and how to avoid expensive mistakes)
-
Picking based on features, not workloads
Fix: profile workloads first, then pick. -
Not testing p95 latency and peak concurrency
Fix: test under realistic concurrency windows, not single-query demos. -
Wrong data model and missing pruning strategy
Fix: invest early in data layout decisions and measurable improvements. -
Underestimating operations and on-call burden
Fix: define ownership, runbooks, and alerting before production launch. -
No observability and no cost guardrails
Fix: instrument latency distributions, freshness SLAs, and cost drivers from day one.
FAQs about comparing Snowflake vs ClickHouse
Is ClickHouse a replacement for a data warehouse?
Sometimes, but not always. If your primary need is governed, multi-team analytics with strong enterprise controls and standardized workflows, many teams still prefer a warehouse-first approach. ClickHouse is often strongest as an analytics serving engine for event-heavy, high-concurrency workloads.
Can Snowflake support near real-time analytics?
It can, depending on how you build the pipeline and what “near real-time” means. The right way to decide is to define freshness and p95 targets, then validate them in a minimal POC under realistic concurrency.
Which is easier to operate with a lean team?
In many setups, Snowflake-style managed operations reduce platform babysitting. ClickHouse-style success can require more discipline around data layout, performance monitoring, and operational readiness, even if you use managed services.
How do I estimate cost without pricing tables?
Focus on cost drivers and workload behavior: data volume growth, query volume, peak concurrency, freshness SLA, and operational maturity. A directional TCO model plus a short POC cost snapshot is usually enough for a confident decision.
What is the minimum POC to decide confidently?
A short POC with 10 to 20 representative queries, 3 concurrency levels, p50 and p95 tracking, freshness measurement, and a documented success threshold. If your POC cannot answer those, it is not decision-grade.
Can a hybrid setup make sense?
Yes, often. If you have both governance-heavy BI and real-time serving needs, a hybrid model can reduce risk: Snowflake for governed warehouse analytics, ClickHouse for real-time interactive analytics, connected through well-defined data contracts.
